Carrito de compra
Su pedido cuenta con 0 productos
Envío gratis a partir de $389.00 (Consulta T&C)
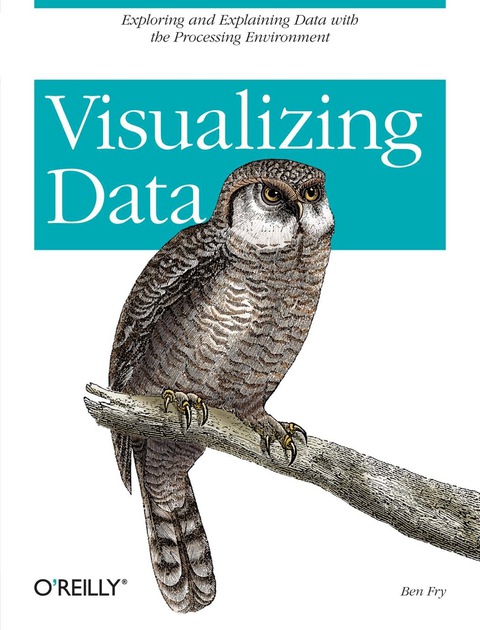
| ISBN: | 9780596519308 |
|---|---|
| Formato: | Page Fidelity |
| Idioma: | Inglés |
| Editorial: | OReilly Media, Inc. |
| Tema: | Computadoras |
| Subtema: | Computación gráfica |
| Número de páginas: | 382 |
| Año de publicación: | 20071218 |
Enormous quantities of data go unused or underused today, simply because people cant visualize the quantities and relationships in it. Using a downloadable programming environment developed by the author, Visualizing Data demonstrates methods for representing data accurately on the Web and elsewhere, complete with user interaction, animation, and more. How do the 3.1 billion A, C, G and T letters of the human genome compare to those of a chimp or a mouse? What do the paths that millions of visitors take through a web site look like? With Visualizing Data, you learn how to answer complex questions like these with thoroughly interactive displays. Were not talking about cookie-cutter charts and graphs. This book teaches you how to design entire interfaces around large, complex data sets with the help of a powerful new design and prototyping tool called "Processing". Used by many researchers and companies to convey specific data in a clear and understandable manner, the Processing beta is available free. With this tool and Visualizing Data as a guide, youll learn basic visualization principles, how to choose the right kind of display for your purposes, and how to provide interactive features that will bring users to your site over and over. This book teaches you: The seven stages of visualizing data -- acquire, parse, filter, mine, represent, refine, and interact How all data problems begin with a question and end with a narrative construct that provides a clear answer without extraneous details Several example projects with the code to make them work Positive and negative points of each representation discussed. The focus is on customization so that each one best suits what you want to convey about your data setThe book does not provide ready-made "visualizations" that can be plugged into any data set. Instead, with chapters divided by types of data rather than types of display, youll learn how each visualization conveys the unique properties of the data it represents -- why the data was collected, whats interesting about it, and what stories it can tell. Visualizing Data teaches you how to answer questions, not simply display information.











 Este sitio web utiliza cookies para mejorar la experiencia del usuario y asegurar su funcionamiento con eficacia.
Al utilizarlo usted acepta el uso de cookies.
Este sitio web utiliza cookies para mejorar la experiencia del usuario y asegurar su funcionamiento con eficacia.
Al utilizarlo usted acepta el uso de cookies.