Carrito de compra
Su pedido cuenta con 0 productos
Envío gratis a partir de $389.00 (Consulta T&C)
| ISBN: | 9783540248064 |
|---|---|
| Formato: | Page Fidelity |
| Idioma: | Inglés |
| Editorial: | Springer Nature |
| Tema: | Ciencia |
| Subtema: | Ciencias de la Tierra geografia |
| Año de publicación: | 2013-03-19 |
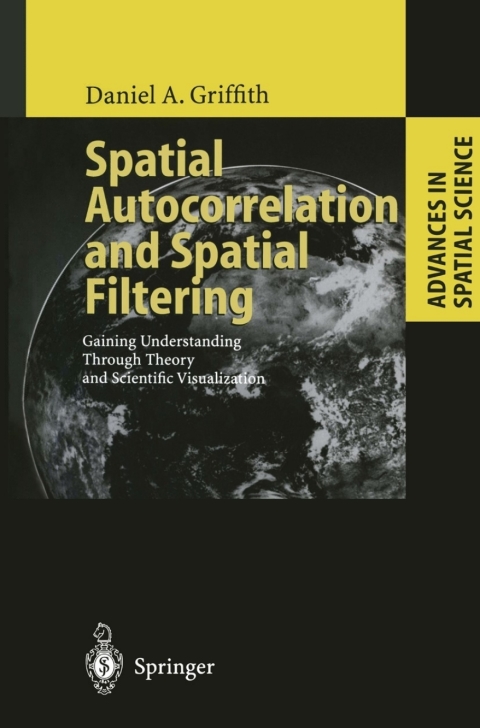
Exploiting the old maxim that "a picture is worth a thousand words," scientific visualization may be defined as the transformation of numerical scientific data into informative graphical displays. It introduces a nonverbal model into subdisciplines that hitherto employed mostly or only mathematical or verbal-conceptual models. The focus of this monograph is on how scientific visualization can help revolutionize the manner in which the tendencies for (dis)similar numerical values to cluster together in location on a map are explored and analyzed, affording spatial data analyses that are better understood, presented, and used. In doing so, the concept known as spatial autocorrelation -Â which characterizes these tendencies and is one of the key features of georeferenced data, or data tagged to the earths surface - is further de-mystified. This self-correlation arises from relative locations in geographic space.











 Este sitio web utiliza cookies para mejorar la experiencia del usuario y asegurar su funcionamiento con eficacia.
Al utilizarlo usted acepta el uso de cookies.
Este sitio web utiliza cookies para mejorar la experiencia del usuario y asegurar su funcionamiento con eficacia.
Al utilizarlo usted acepta el uso de cookies.