Carrito de compra
Su pedido cuenta con 0 productos
Envío gratis a partir de $389.00 (Consulta T&C)
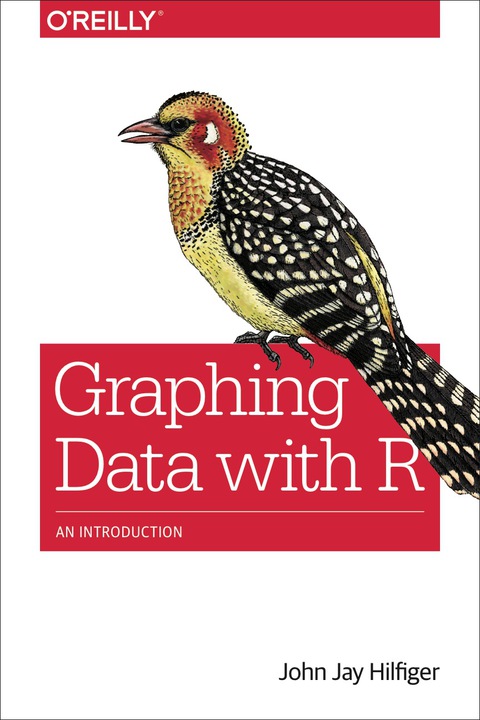
| ISBN: | 9781491922583 |
|---|---|
| Formato: | Page Fidelity |
| Idioma: | Inglés |
| Editorial: | OReilly Media, Inc. |
| Tema: | Computadoras |
| Subtema: | Banco de datos general |
| Año de publicación: | 20151019 |
It much easier to grasp complex data relationships with a graph than by scanning numbers in a spreadsheet. This introductory guide shows you how to use the R language to create a variety of useful graphs for visualizing and analyzing complex data for science, business, media, and many other fields. You’ll learn methods for highlighting important relationships and trends, reducing data to simpler forms, and emphasizing key numbers at a glance. Anyone who wants to analyze data will find something useful here—even if you don’t have a background in mathematics, statistics, or computer programming. If you want to examine data related to your work, this book is the ideal way to start. Get started with R by learning basic commands Build single variable graphs, such as dot and pie charts, box plots, and histograms Explore the relationship between two quantitative variables with scatter plots, high-density plots, and other techniques Use scatterplot matrices, 3D plots, clustering, heat maps, and other graphs to visualize relationships among three or more variables











 Este sitio web utiliza cookies para mejorar la experiencia del usuario y asegurar su funcionamiento con eficacia.
Al utilizarlo usted acepta el uso de cookies.
Este sitio web utiliza cookies para mejorar la experiencia del usuario y asegurar su funcionamiento con eficacia.
Al utilizarlo usted acepta el uso de cookies.