Carrito de compra
Su pedido cuenta con 0 productos
Envío gratis a partir de $389.00 (Consulta T&C)
| ISBN: | 9783319497518 |
|---|---|
| Formato: | Page Fidelity |
| Idioma: | Inglés |
| Editorial: | Springer Nature |
| Tema: | Computadoras |
| Subtema: | Computación gráfica |
| Año de publicación: | 2017-01-31 |
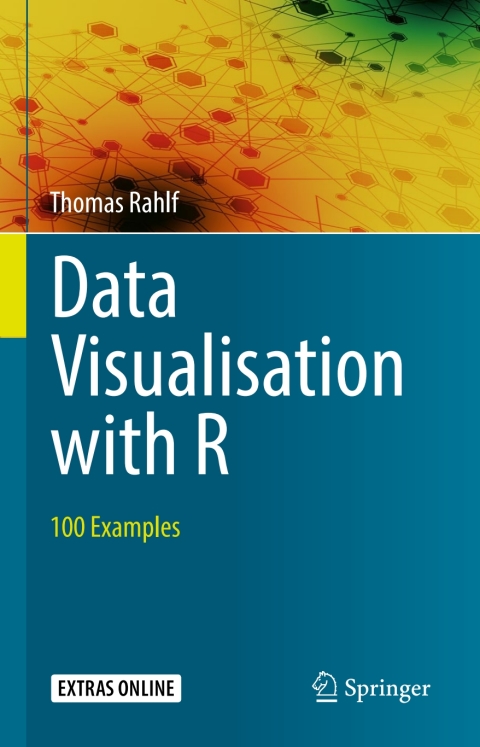
This book introduces readers to the fundamentals of creating presentation graphics using R, based on 100 detailed and complete scripts. It shows how bar and column charts, population pyramids, Lorenz curves, box plots, scatter plots, time series, radial polygons, Gantt charts, heat maps, bump charts, mosaic and balloon charts, and a series of different thematic map types can be created using R Base Graphics System. Every example uses real data and includes step-by-step explanations of the figures and their programming. The open source software R is an established standard and a powerful tool for various visualizing applications, integrating nearly all technologies relevant for data visualization. The basic software, enhanced by more than 7000 extension packs currently freely available, is intensively used by organizations including Google, Facebook and the CIA. The book serves as a comprehensive reference guide to a broad variety of applications in various fields. This book is intended for all kinds of R users, ranging from experts, for whom especially the example codes are particularly useful, to beginners, who will find the finished graphics most helpful in learning what R can actually deliver.Â










 Este sitio web utiliza cookies para mejorar la experiencia del usuario y asegurar su funcionamiento con eficacia.
Al utilizarlo usted acepta el uso de cookies.
Este sitio web utiliza cookies para mejorar la experiencia del usuario y asegurar su funcionamiento con eficacia.
Al utilizarlo usted acepta el uso de cookies.